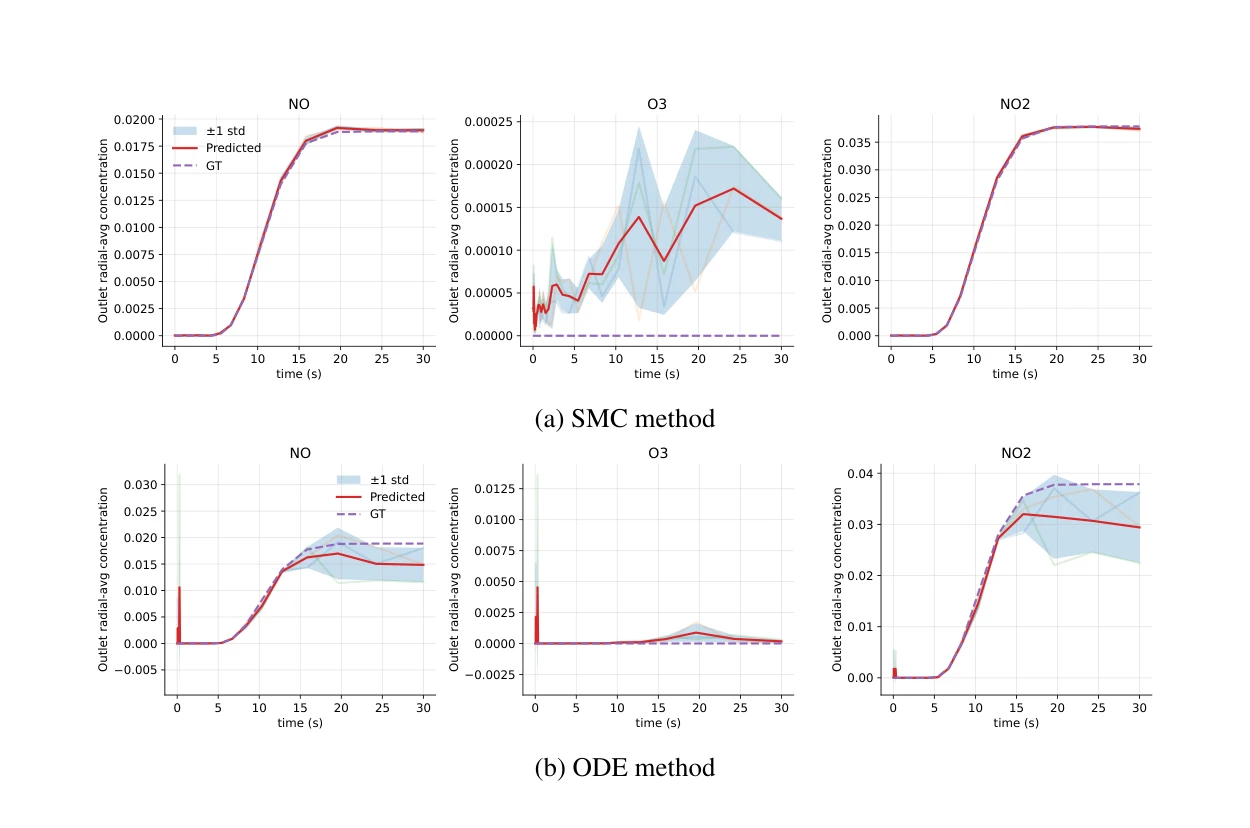
์ ์: | ๋ ์ง: 2026-03-05 | URL: https://arxiv.org/abs/2603.05139 📄 PDF
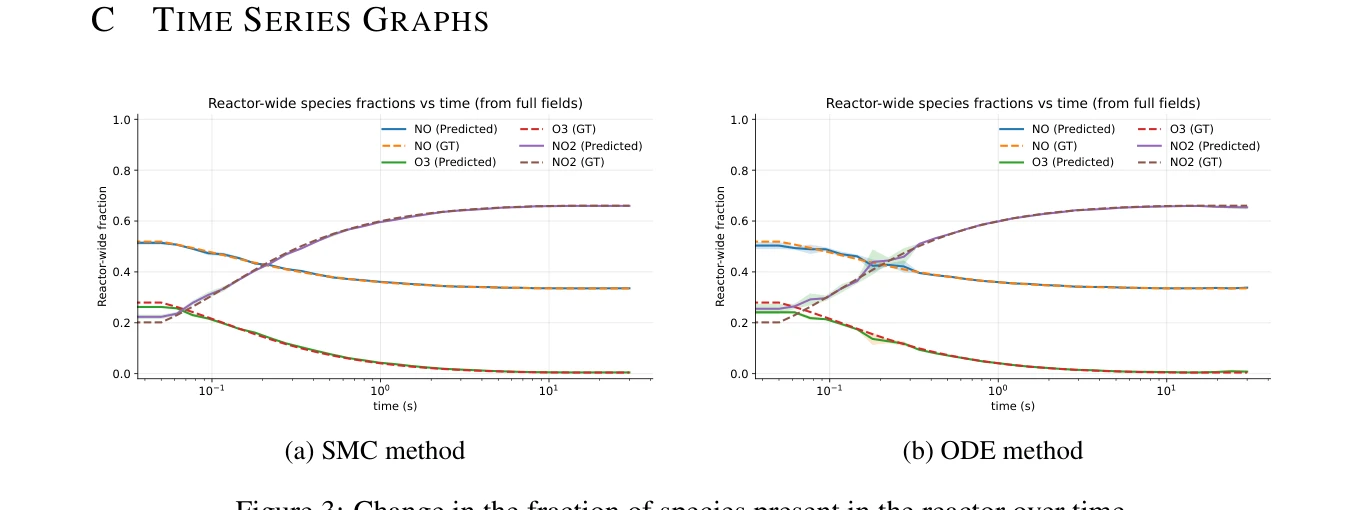
Figure 3: Change in the fraction of species present in the reactor over time.
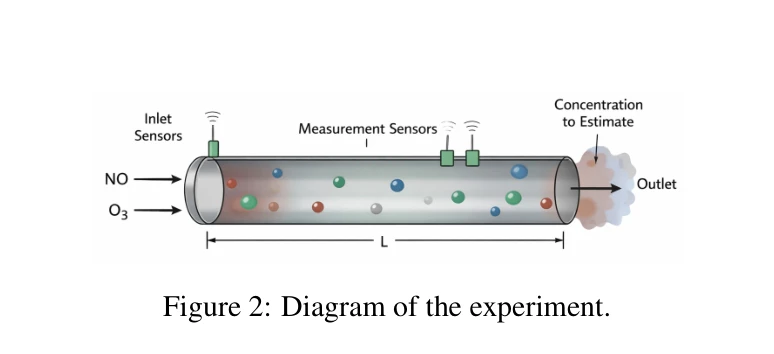
๋ณธ ๋ ผ๋ฌธ์ advection-reaction-diffusion (ARD) ๋ฐฉ์ ์์ผ๋ก ์ง๋ฐฐ๋๋ ๊ธฐ์ฒด์ ํํ ๋ฐ์ ์์คํ ์ diffusion model ๊ธฐ๋ฐ์ physics-guided sampling์ ์ ์ฉํ์ฌ, ๋ค์ํ ๋งค๊ฐ๋ณ์์์ ๋ฐ์-์์ก ํ์์ ์ ํํ ๋๋์ฅ ์์ธก์ ์์ฐํ๋ค. ํนํ ํ์ต๋์ง ์์ ๋งค๊ฐ๋ณ์ ๊ฐ์์๋ ๋์ ์ ํ๋๋ฅผ ์ ์งํ๋ฉฐ, sequential Monte Carlo (SMC) ํ๋ ์์ํฌ ๋ด์์ PDE ์์ฐจ ๊ธฐ๋ฐ likelihood๋ฅผ ํ์ฉํด ์๊ณต๊ฐ ๋๋์ฅ์ ์ฌ๊ตฌ์ฑํ๋ค.
Figure 1: Predicted species concentration at the outlet over time for an example simulation averaged
Figure 2: Diagram of the experiment.
์ดํ: ๋ณธ ๋ ผ๋ฌธ์ diffusion model์ ์ค์ ํํ ๋ฐ์ ์์คํ ์ ์ฑ๊ณต์ ์ผ๋ก ์ ์ฉํ ํ์ ์ ์ฌ๋ก๋ก, physics-guided sampling์ ์ค์ฉ์ฑ์ ์ ์ฆํ๋ค. ๋ณตํฉ likelihood ์ค๊ณ, ๋งค๊ฐ๋ณ์ ์ธ์ฝ ๋ฅ๋ ฅ, ํฌ์ ๋ฐ์ดํฐ ์ฒ๋ฆฌ ์ธก๋ฉด์์ ๊ธฐ์ ์ ๊ธฐ์ฌ๊ฐ ๋ช ํํ๋, ๊ณ์ฐ ํจ์จ์ฑ ๊ฒ์ฆ, ๋ ๋ณต์กํ ํํ ๋ฉ์ปค๋์ฆ์ผ๋ก์ ํ์ฅ, ๊ทธ๋ฆฌ๊ณ ์ฐ์ ๊ท๋ชจ ์ ์ฉ ๊ฐ๋ฅ์ฑ์ ๋ํ ์ถ๊ฐ ์ฐ๊ตฌ๊ฐ ํ์ํ๋ค.