Essence
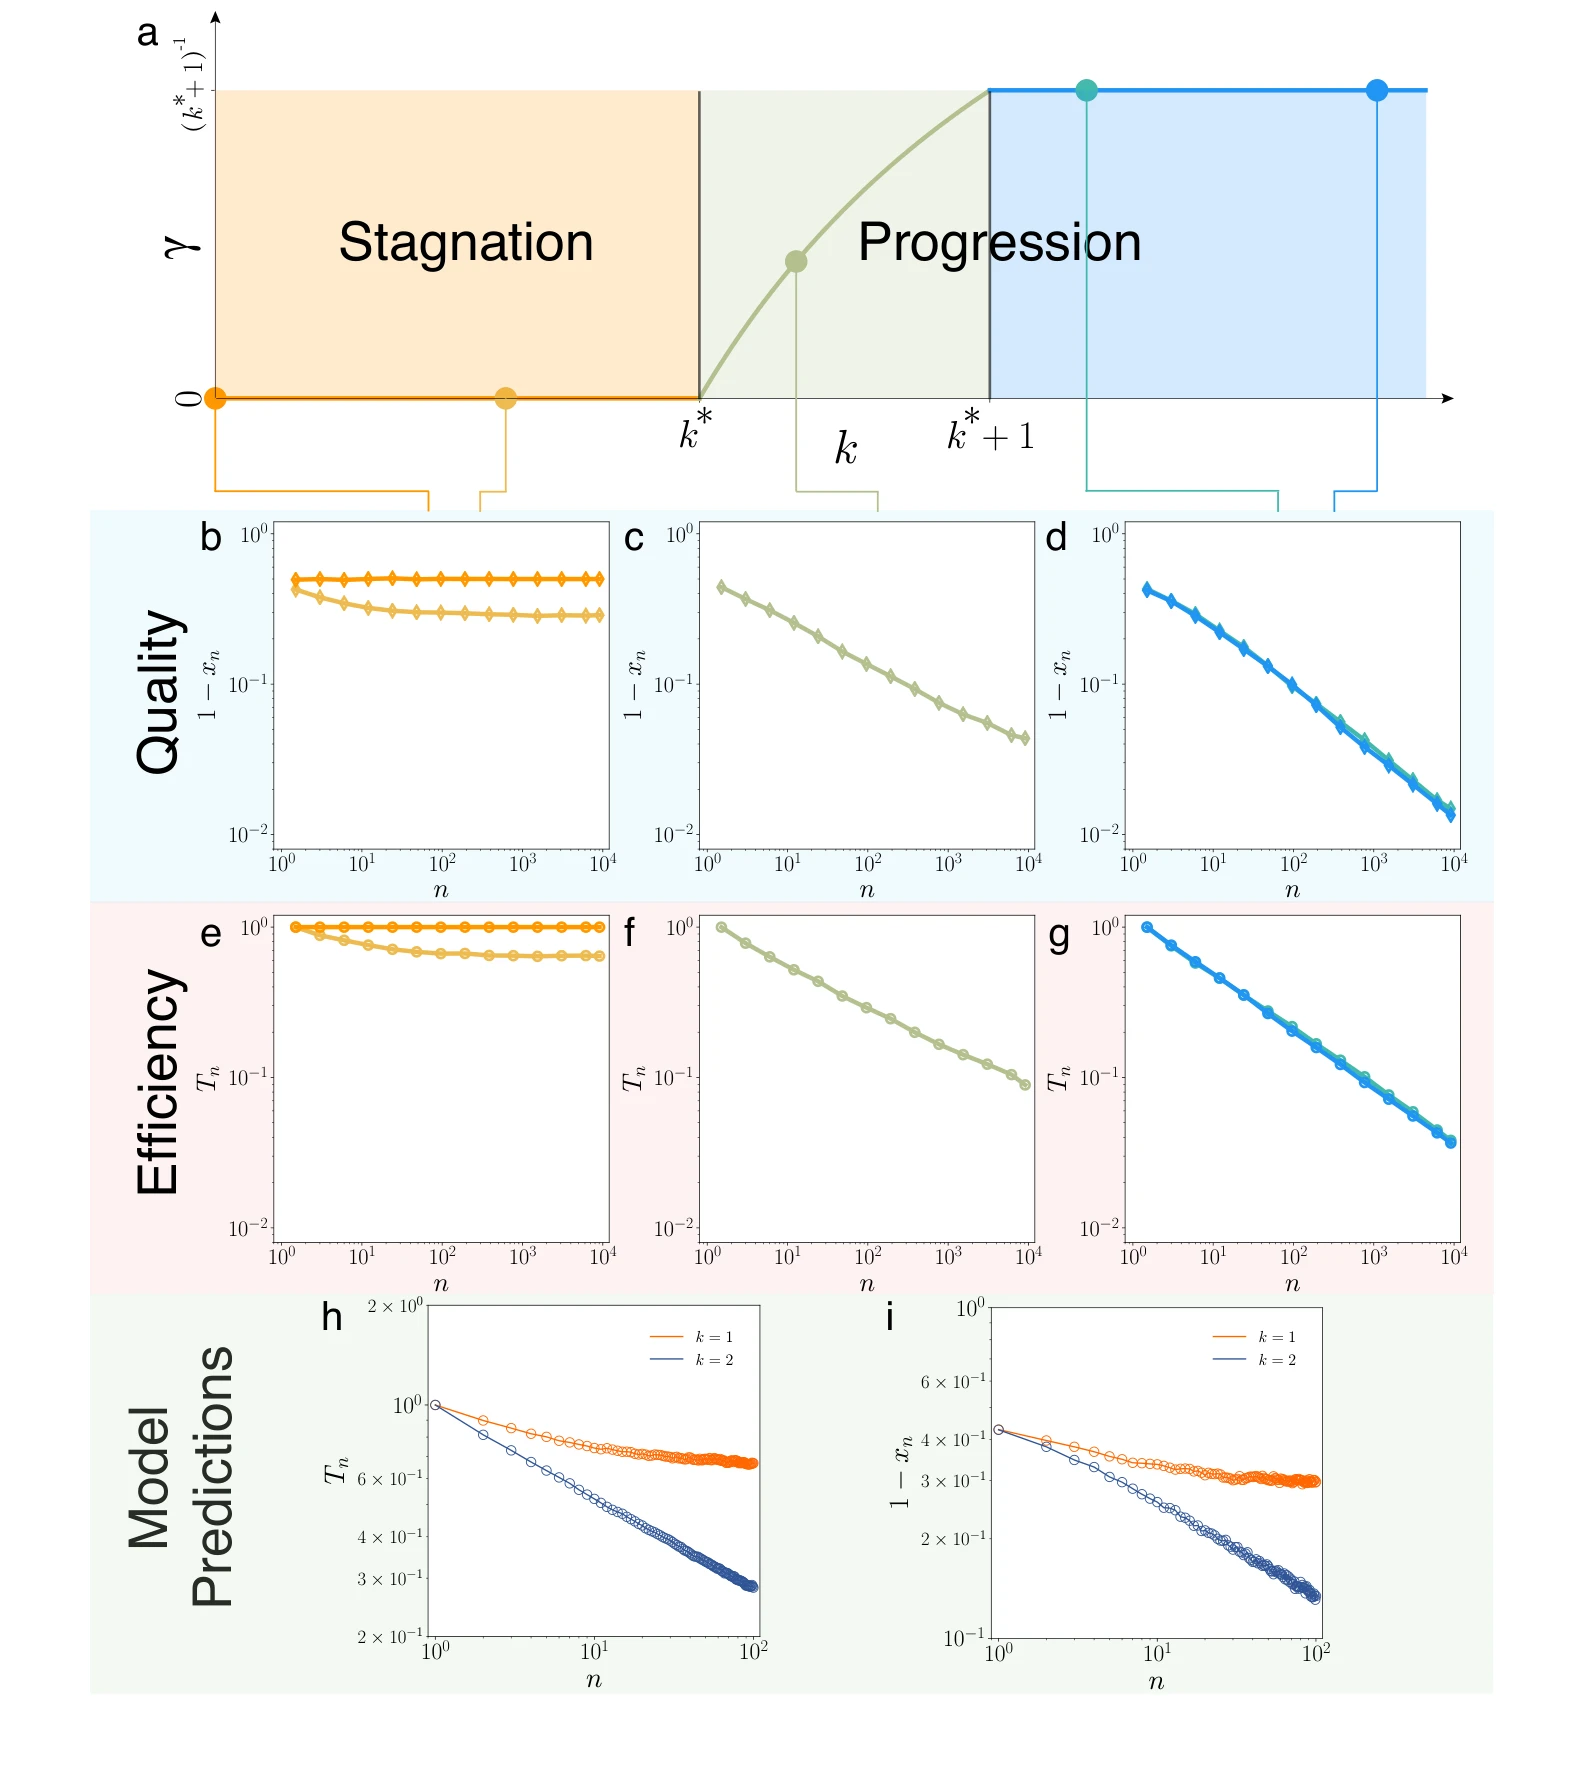
Figure 3: Phase diagram of the model. (a) Analytical solution of the model reveals that the
과학, 스타트업, 보안 등 다양한 분야에서 반복된 실패의 역학을 설명하는 일-매개변수 모델을 개발하여, 실패 후 성공으로 이어지는 동역학의 위상 전이를 발견했다.
저자: Yian Yin, Yang Wang, James A. Evans, Dashun Wang | 날짜: 2019 | DOI: 10.1038/s41586-019-1725-y 📄 PDF
Figure 3: Phase diagram of the model. (a) Analytical solution of the model reveals that the
과학, 스타트업, 보안 등 다양한 분야에서 반복된 실패의 역학을 설명하는 일-매개변수 모델을 개발하여, 실패 후 성공으로 이어지는 동역학의 위상 전이를 발견했다.
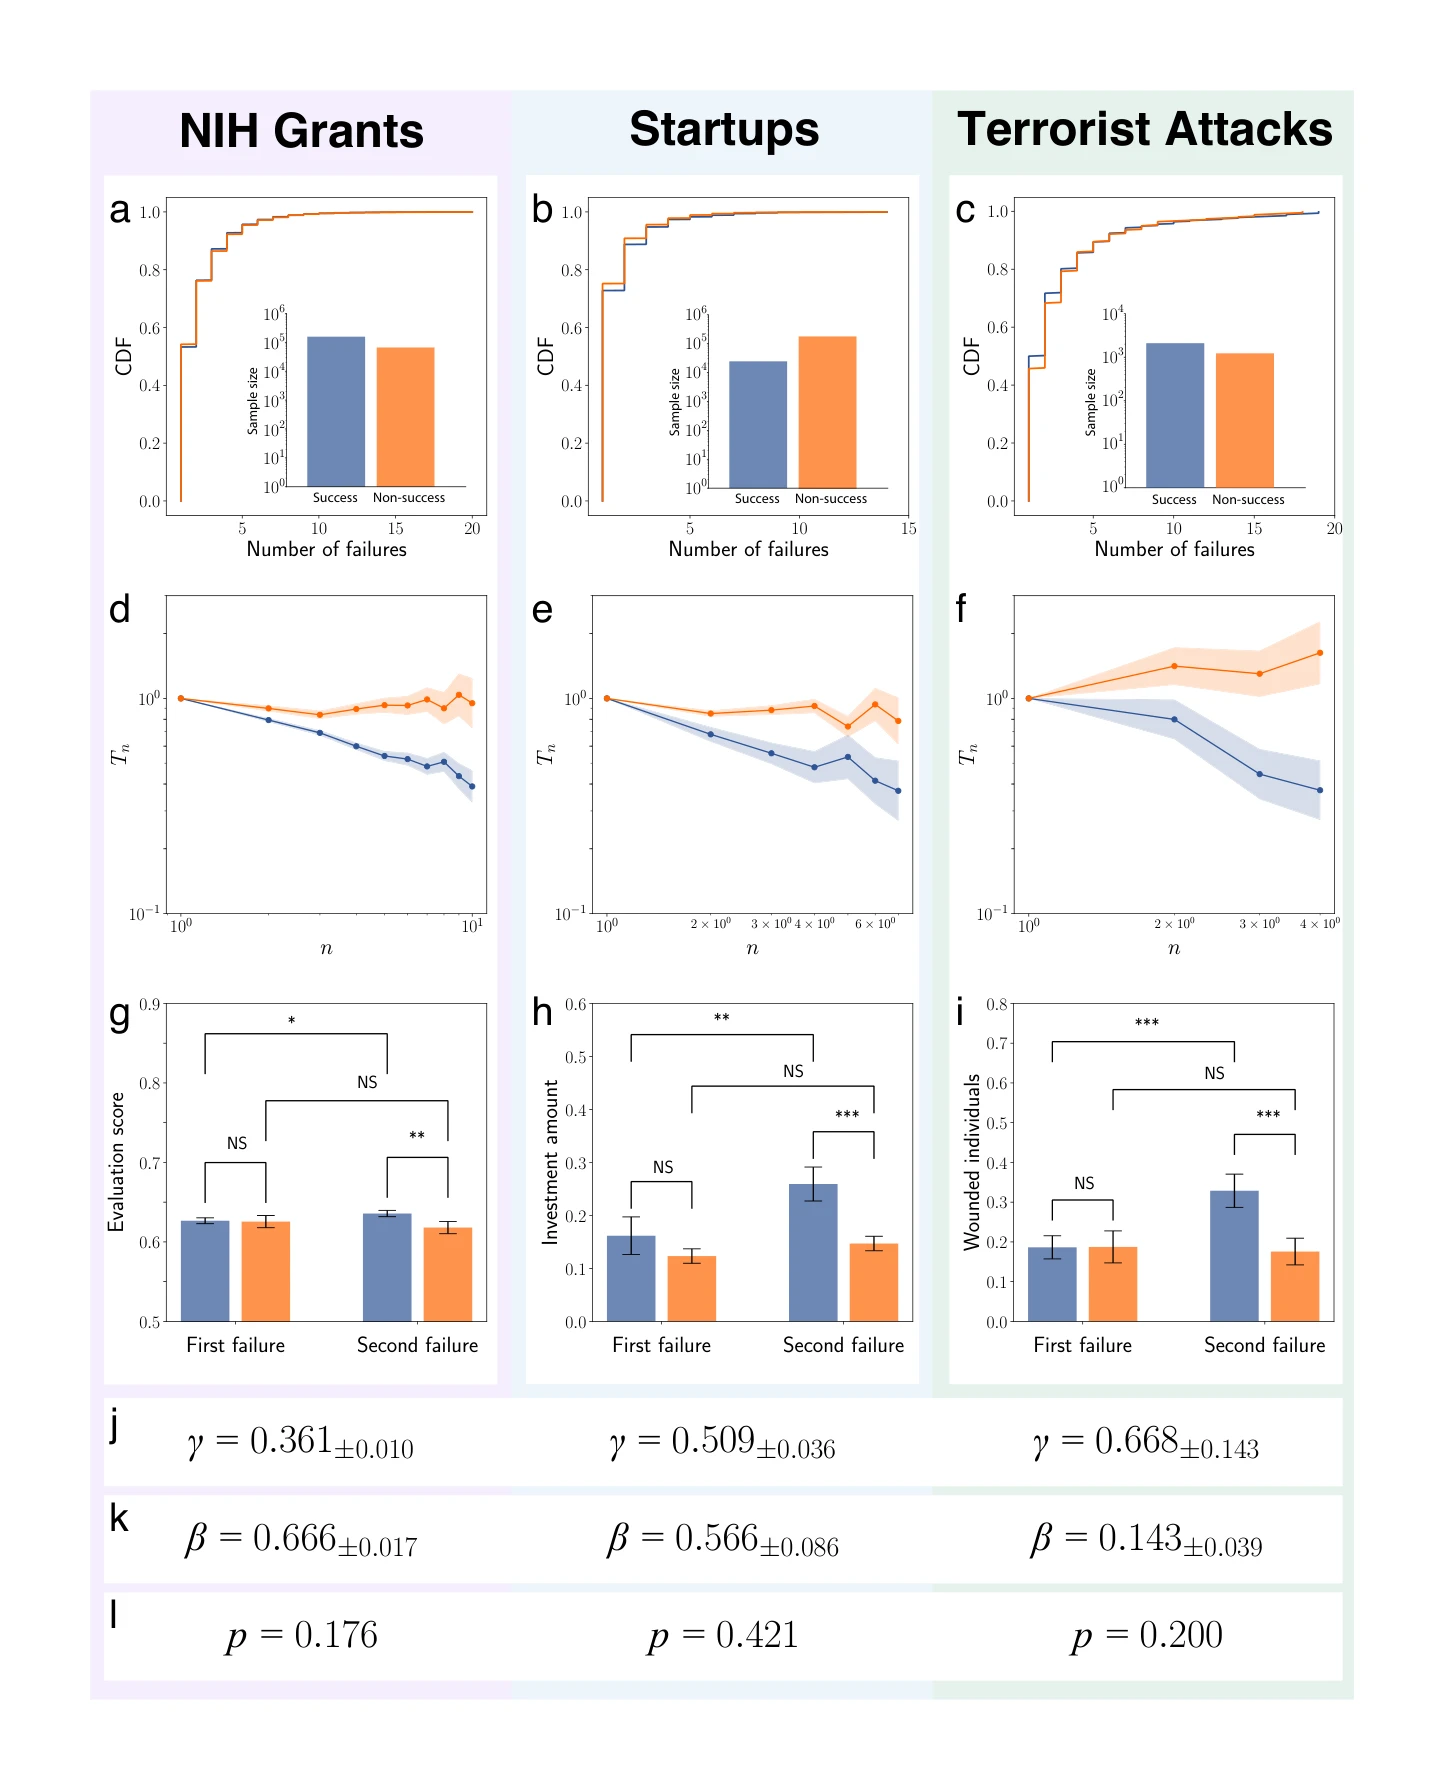
Figure 4: Testing model predictions. (a-c) Complementary cumulative distribution (CCDF) of
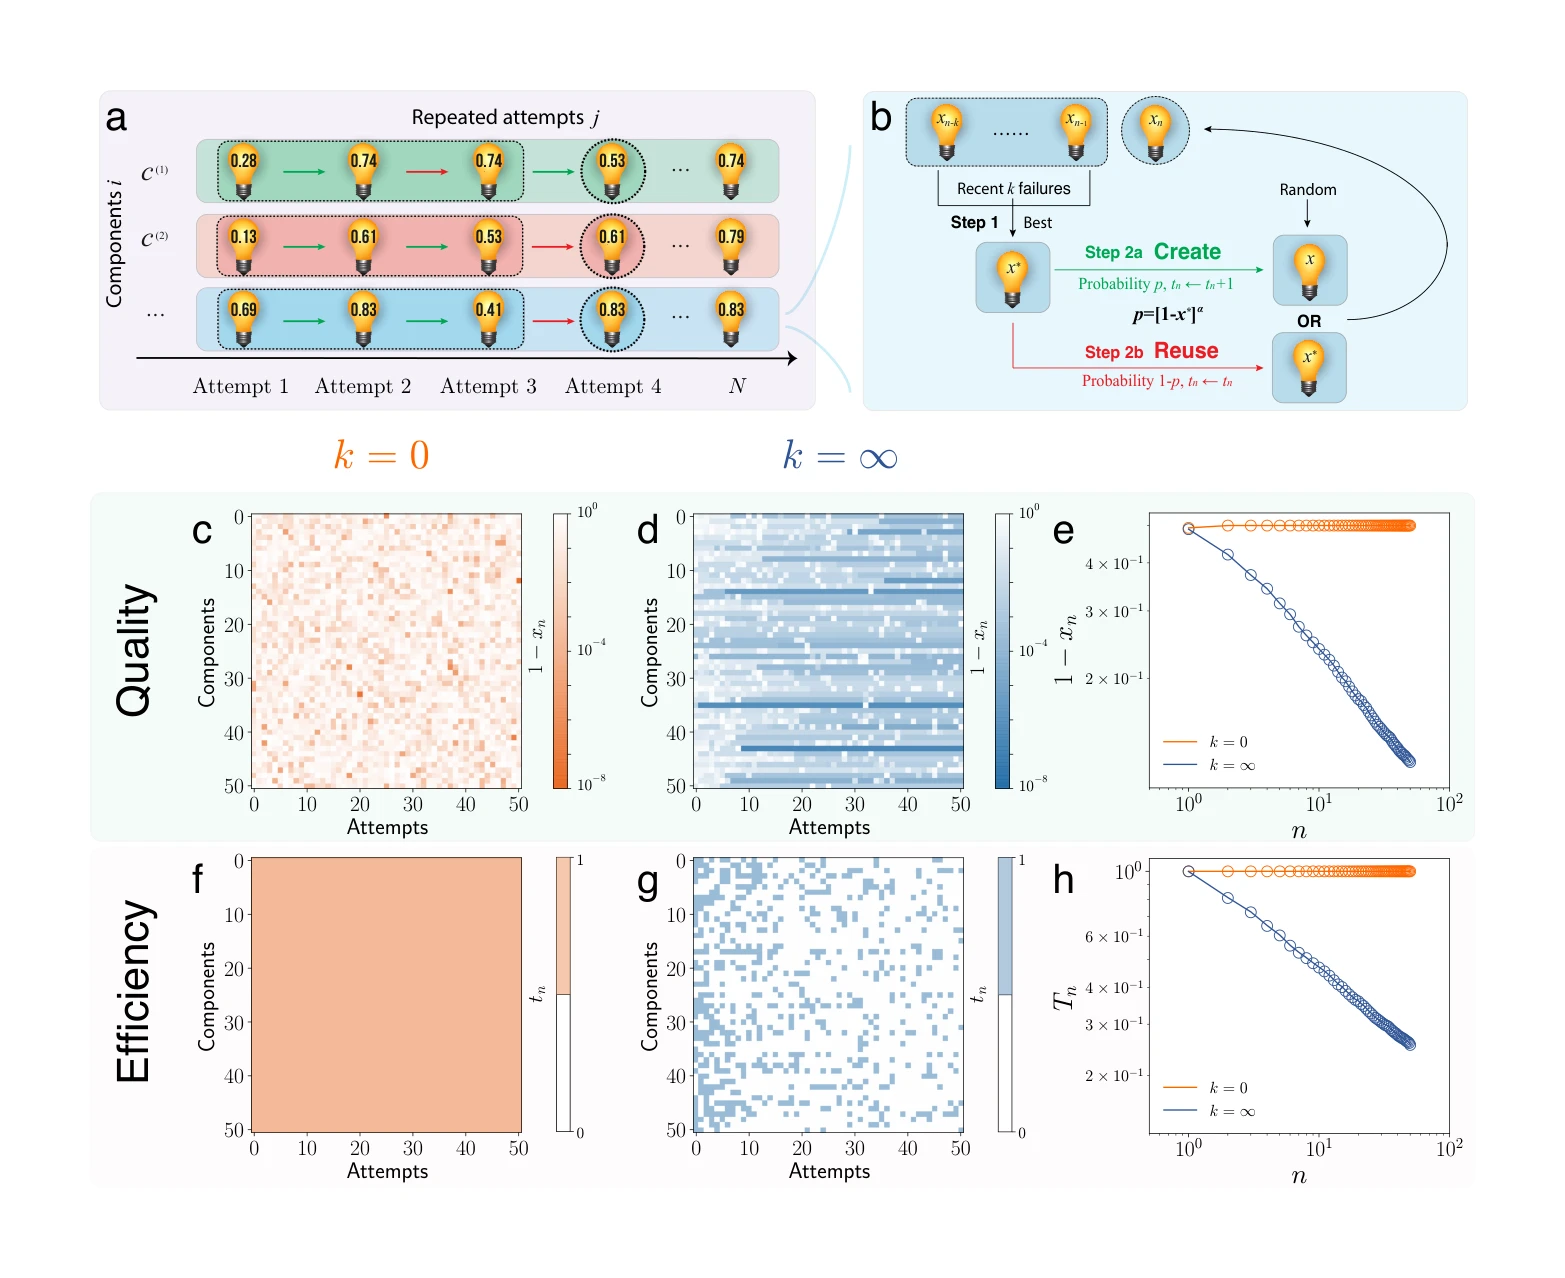
Figure 2: The k model. (a) Here we treat each attempt as a combination of independent compo-
총평: 실패의 동역학을 최초로 수학적으로 정량화하고 위상 전이를 통해 설명한 획기적 연구이며, 3개 대규모 이질적 데이터셋에서 보편성을 입증함으로써 학제적 영향력이 크다.