Essence
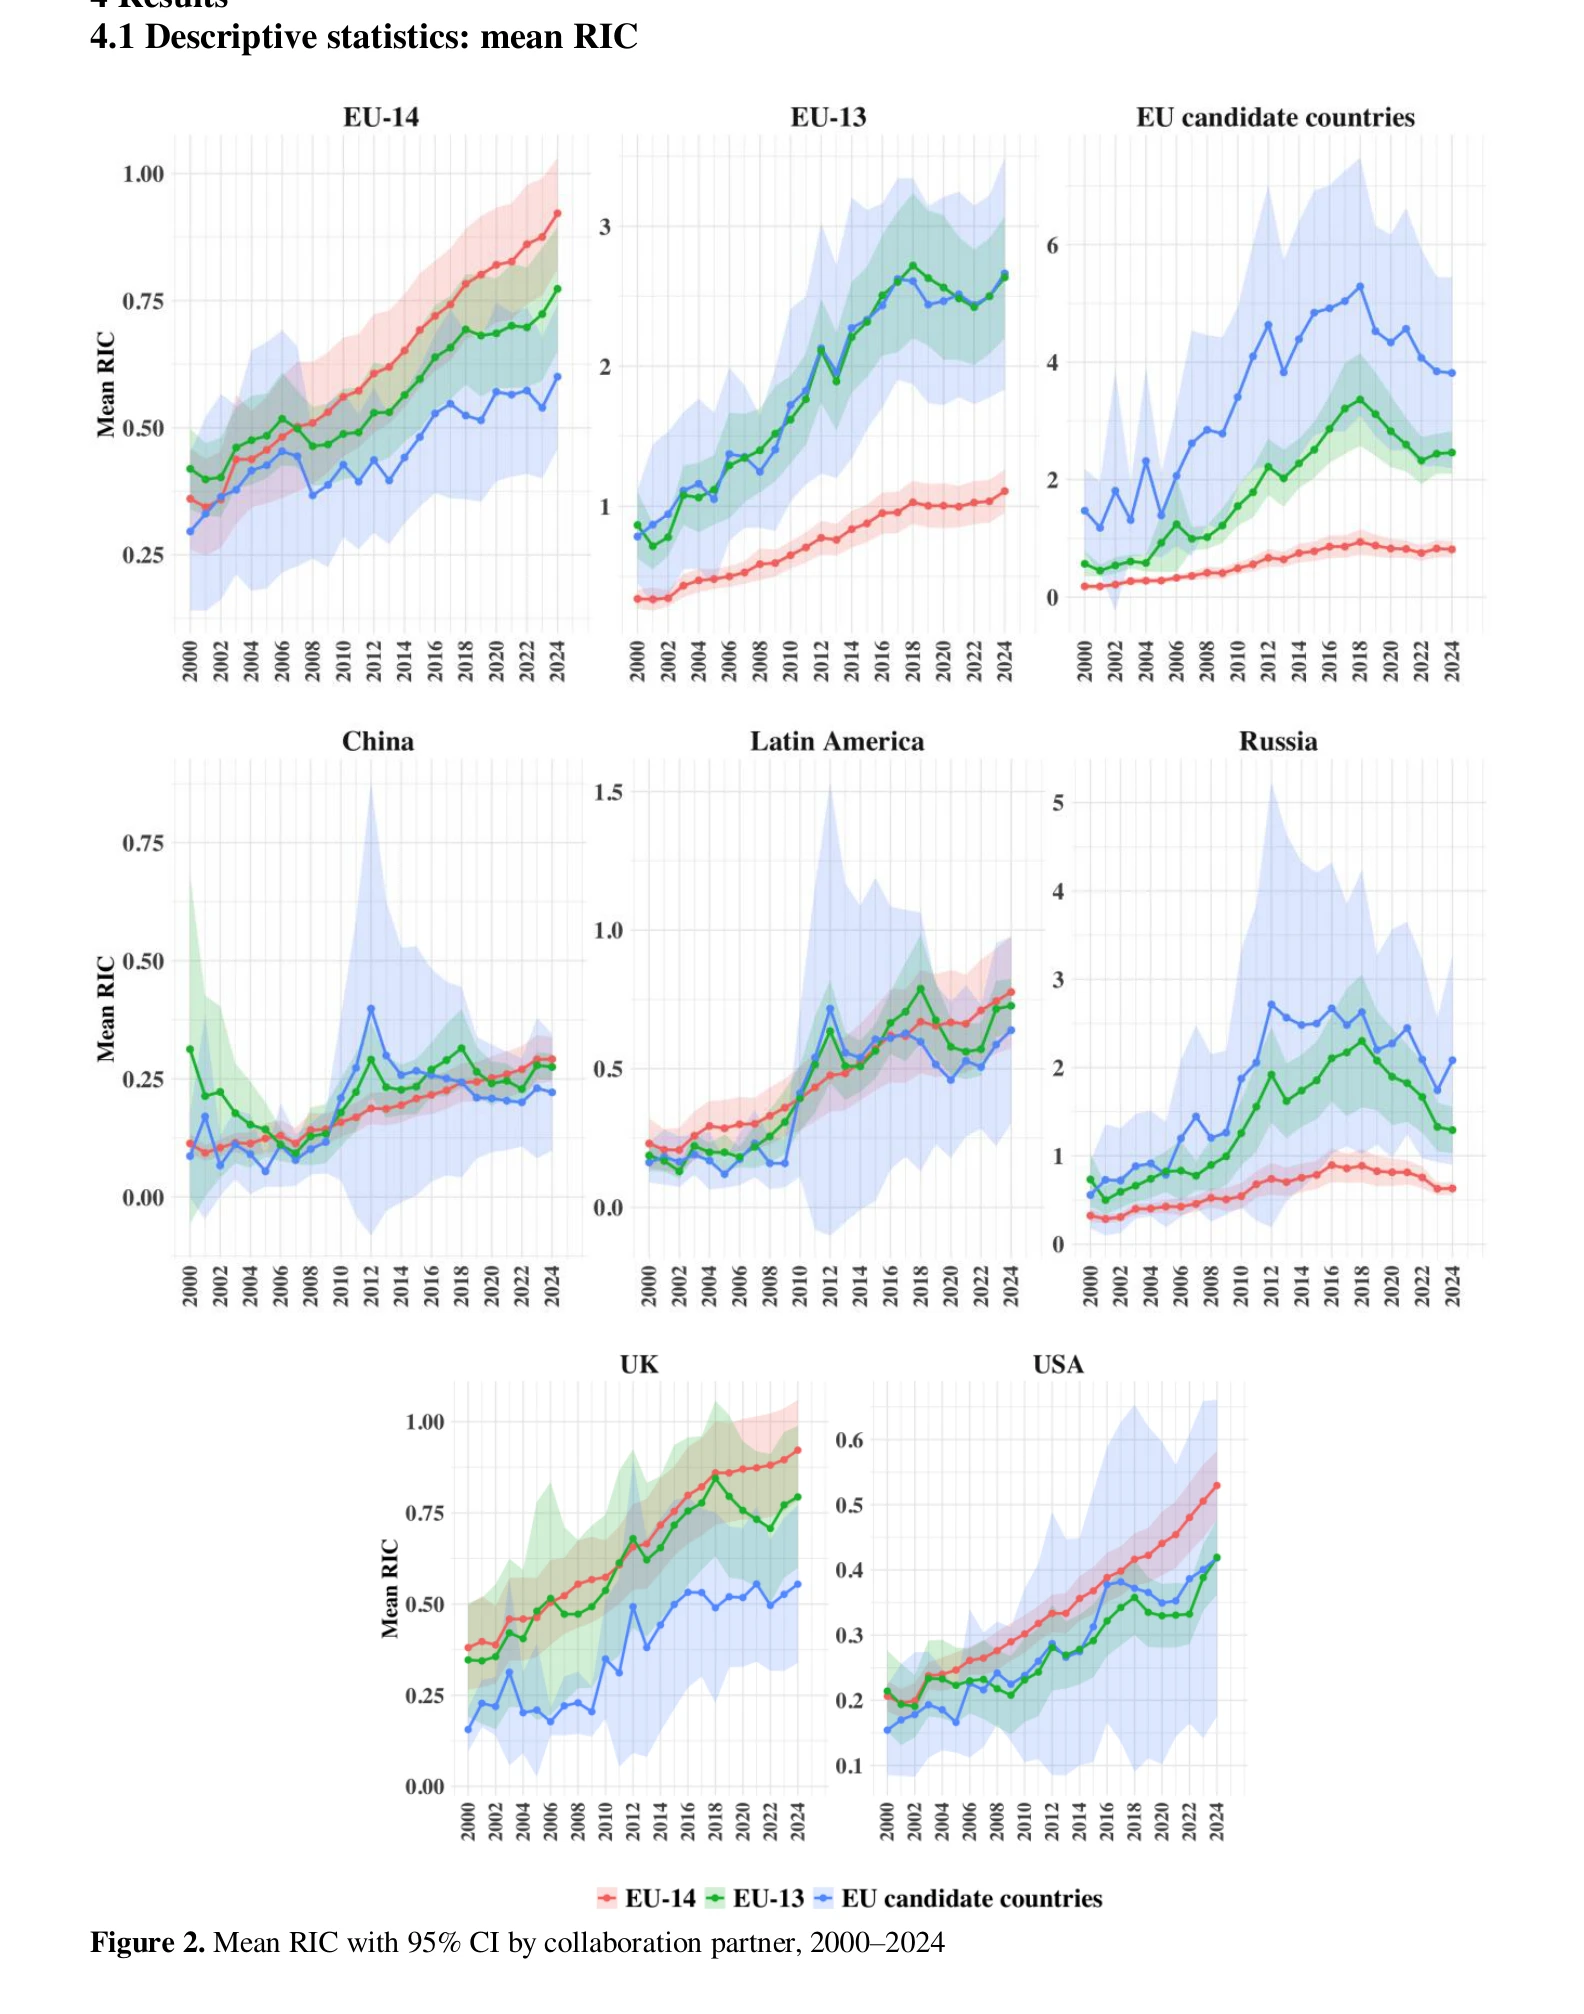
Figure 2 illustrates the evolution of mean RIC across EU groups and with major global partners
이 연구는 2000-2024년 동안 EU 통합, 세계화, 지정학적 변동이 EU-14, EU-13, EU 후보국 간의 과학 협력에 미친 영향을 Scopus 데이터베이스의 Relative Intensity of Collaboration(RIC) 분석을 통해 탐구한다.
Evaluation
Novelty: 4/5 Technical Soundness: 3/5 Significance: 4/5 Clarity: 4/5 Overall: 4/5
총평: 이 연구는 EU 통합 과정에서의 과학 협력 동향을 포괄적이고 체계적으로 분석하여 유럽 연구 정책의 효과성을 평가하고 지정학적 변동에 대한 네트워크의 탄력성을 규명했다. 명확한 데이터 기반의 발견과 정책 함의를 제시하나, Scopus 데이터 편향과 공저자 분석의 한계를 보완한 추가 분석이 요청된다.