Essence
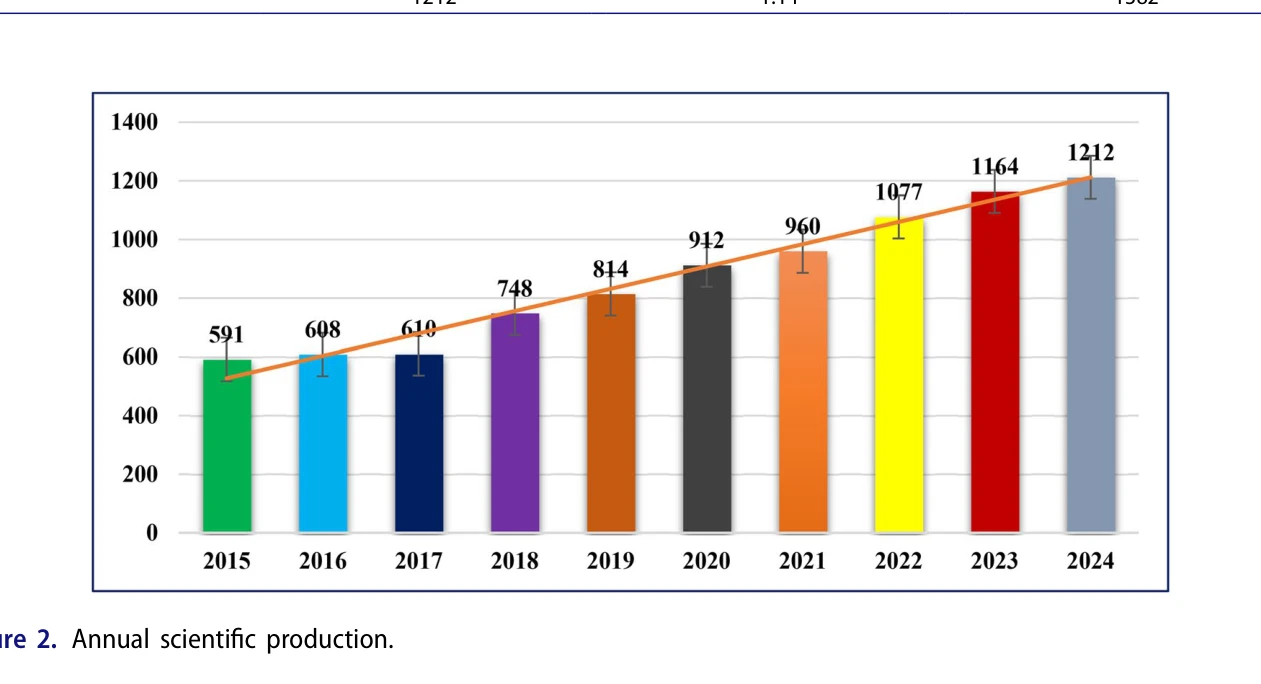
Figure 2. Annual scientific production.
본 연구는 2015년부터 2024년까지 사회과학 분야의 보상(compensation) 연구에 대한 글로벌 동향을 Scopus 데이터베이스의 8,696개 논문을 대상으로 bibliometric analysis를 수행하여 지식 네트워크를 매핑한 종설 논문이다.
저자: Basudeb Jana, Bijayalaxmi Rautaray, Chandrakanta Swain, Dillip K. Swain | 날짜: 2026-05-13 | DOI: 10.1080/23311886.2026.2666455 📄 PDF
Figure 2. Annual scientific production.
본 연구는 2015년부터 2024년까지 사회과학 분야의 보상(compensation) 연구에 대한 글로벌 동향을 Scopus 데이터베이스의 8,696개 논문을 대상으로 bibliometric analysis를 수행하여 지식 네트워크를 매핑한 종설 논문이다.
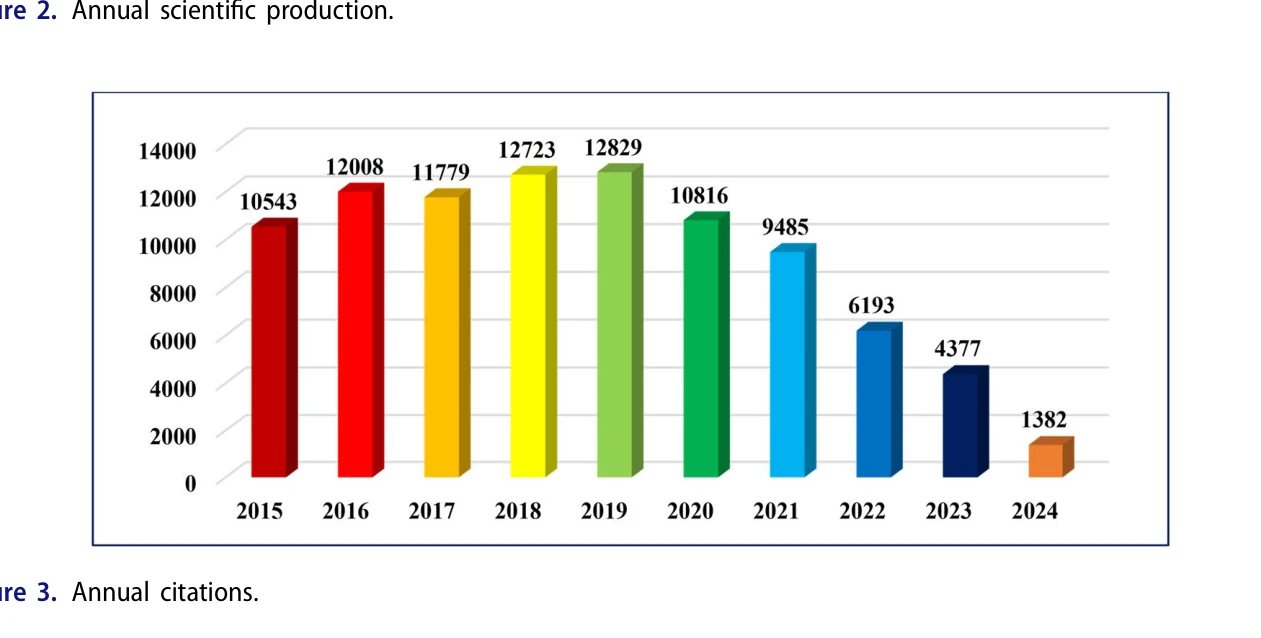
Figure 3 shows the annual growth in the citation counts of publications. The maximum number of
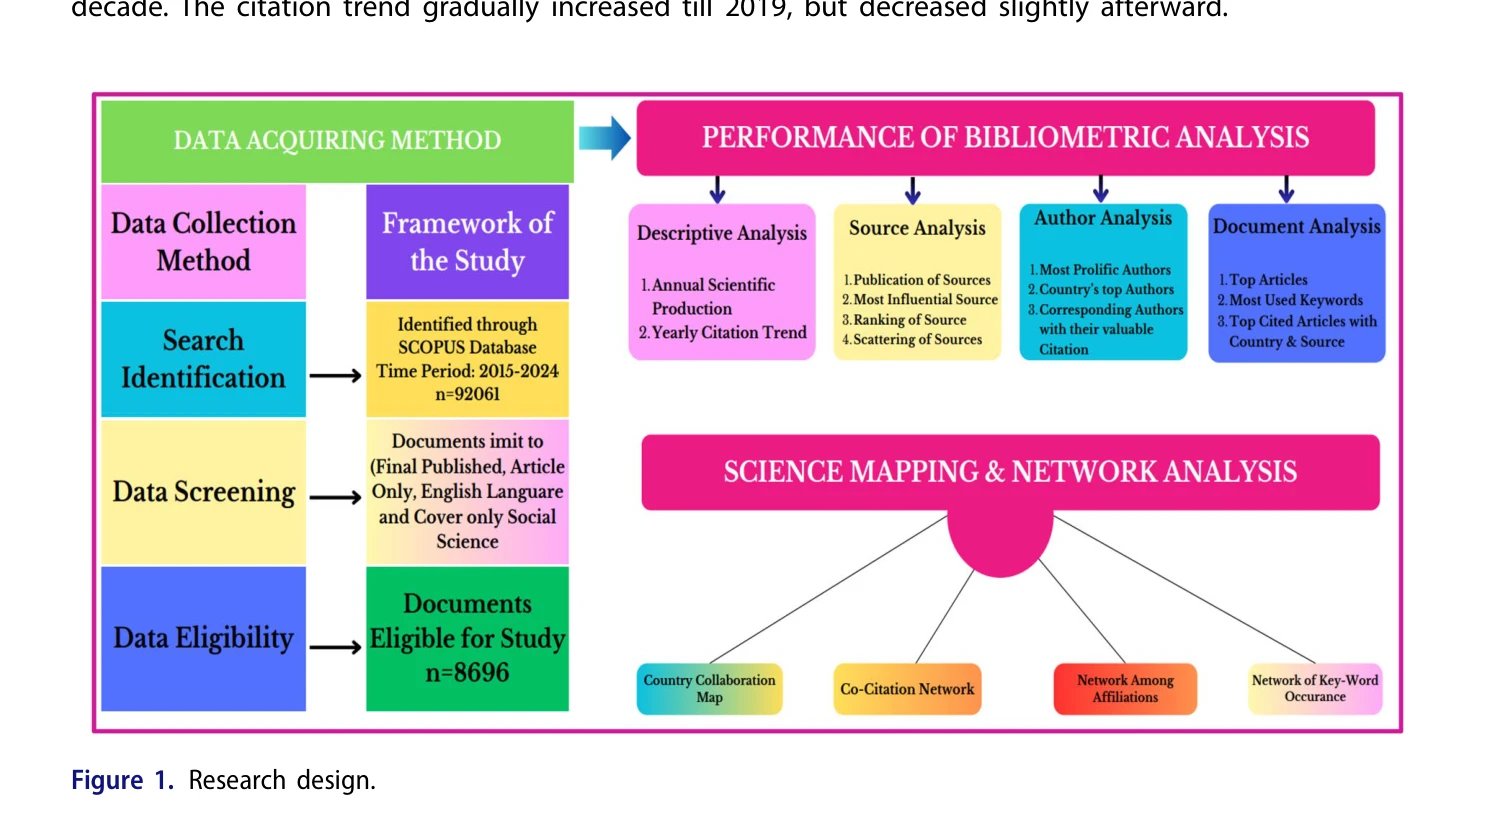
Figure 1 shows the research design adopted by this study, starting from the data collection method,
총평: 본 연구는 보상 연구에 대한 포괄적 bibliometric 분석으로 글로벌 연구 동향을 효과적으로 매핑하였으며, 저자, 국가, 주요 저널, 핵심 키워드를 규명하여 향후 보상 연구의 방향 설정에 실질적 가치를 제공한다. 다만 단일 데이터베이스 사용과 정성적 분석의 한계가 있어 보완 연구가 필요하다.