Essence
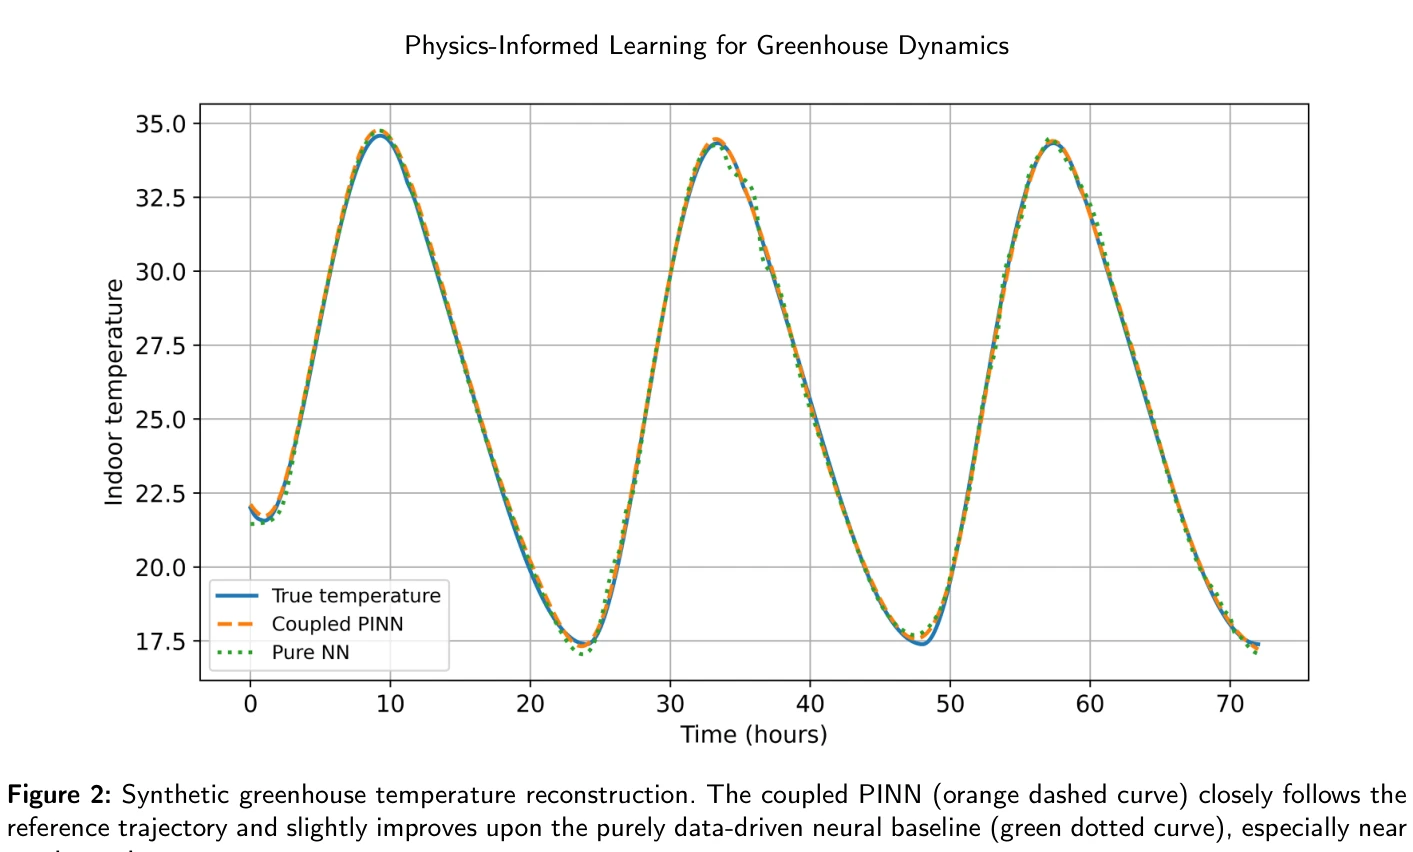
Figure 2: Synthetic greenhouse temperature reconstruction. The coupled PINN (orange dashed curve) closely follows the
Physics-Informed Neural Networks(PINN)을 이용해 온실의 온도·습도 결합 동역학에서 상태 복원과 파라미터 식별을 동시에 수행하는 프레임워크를 제안한다.
저자: Sani Biswas, Khursheed J. Ansari, Md. Nasim Akhtar | 날짜: 2026-05-04 | URL: https://arxiv.org/abs/2605.02524 📄 PDF
Figure 2: Synthetic greenhouse temperature reconstruction. The coupled PINN (orange dashed curve) closely follows the
Physics-Informed Neural Networks(PINN)을 이용해 온실의 온도·습도 결합 동역학에서 상태 복원과 파라미터 식별을 동시에 수행하는 프레임워크를 제안한다.
Figure 2: Synthetic greenhouse temperature reconstruction. The coupled PINN (orange dashed curve) closely follows the
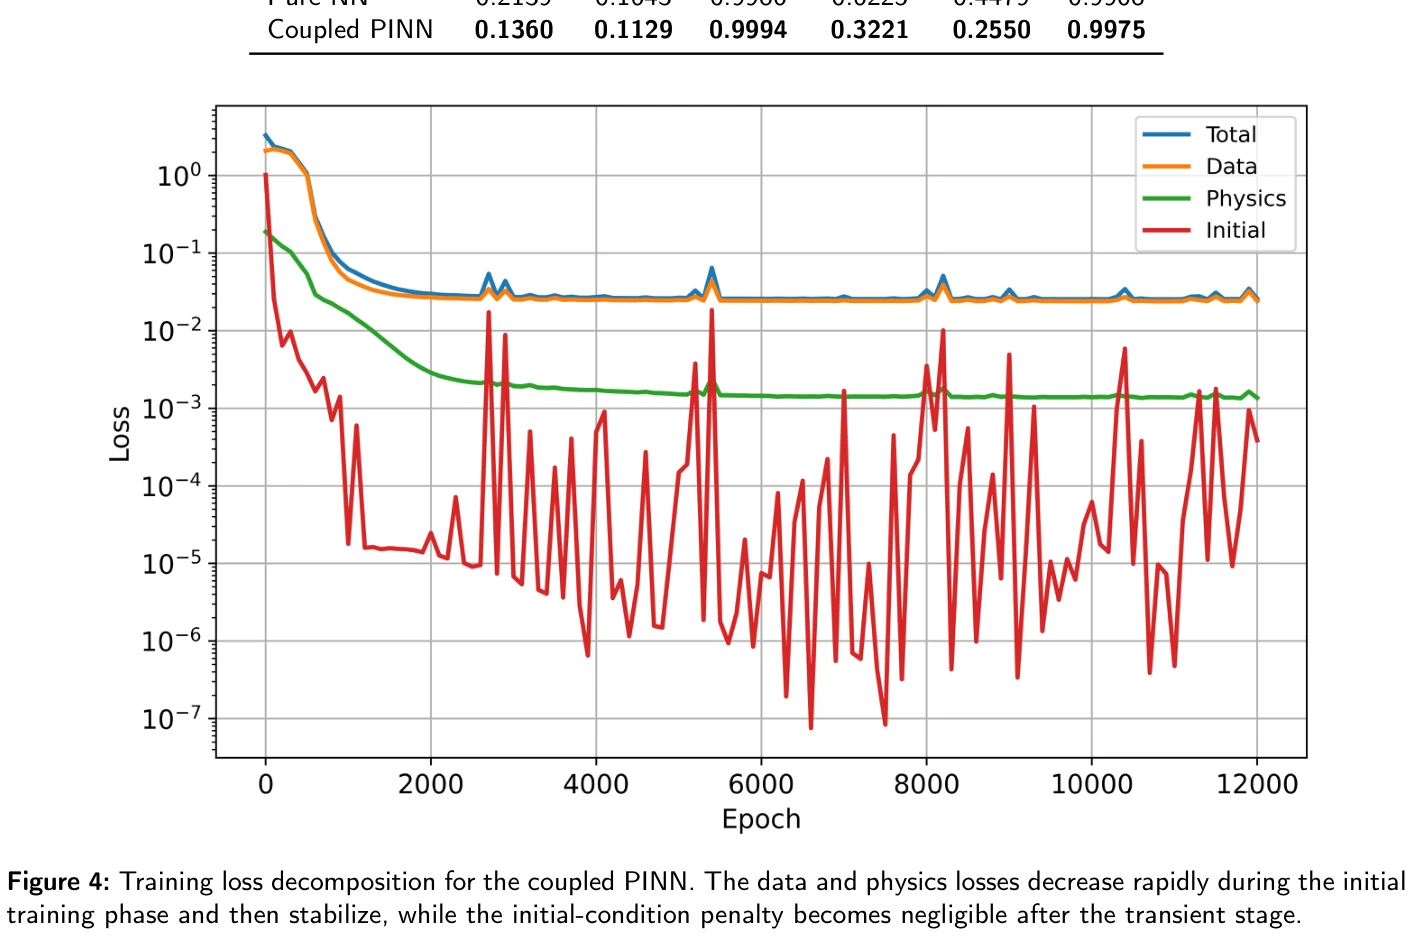
Figure 4: Training loss decomposition for the coupled PINN. The data and physics losses decrease rapidly during the init
총평: 온실 환경의 결합 온습도 동역학에 physics-informed learning을 체계적으로 적용한 의미 있는 기여로, 희소·잡음 관측 하의 상태 복원·파라미터 식별이라는 실질적 난제를 물리 제약으로 효과적으로 완화한다. 다만 합성 벤치마크 중심의 평가가 현장 적용성을 제한하므로 추후 실제 데이터 검증이 필수적이다.