Essence
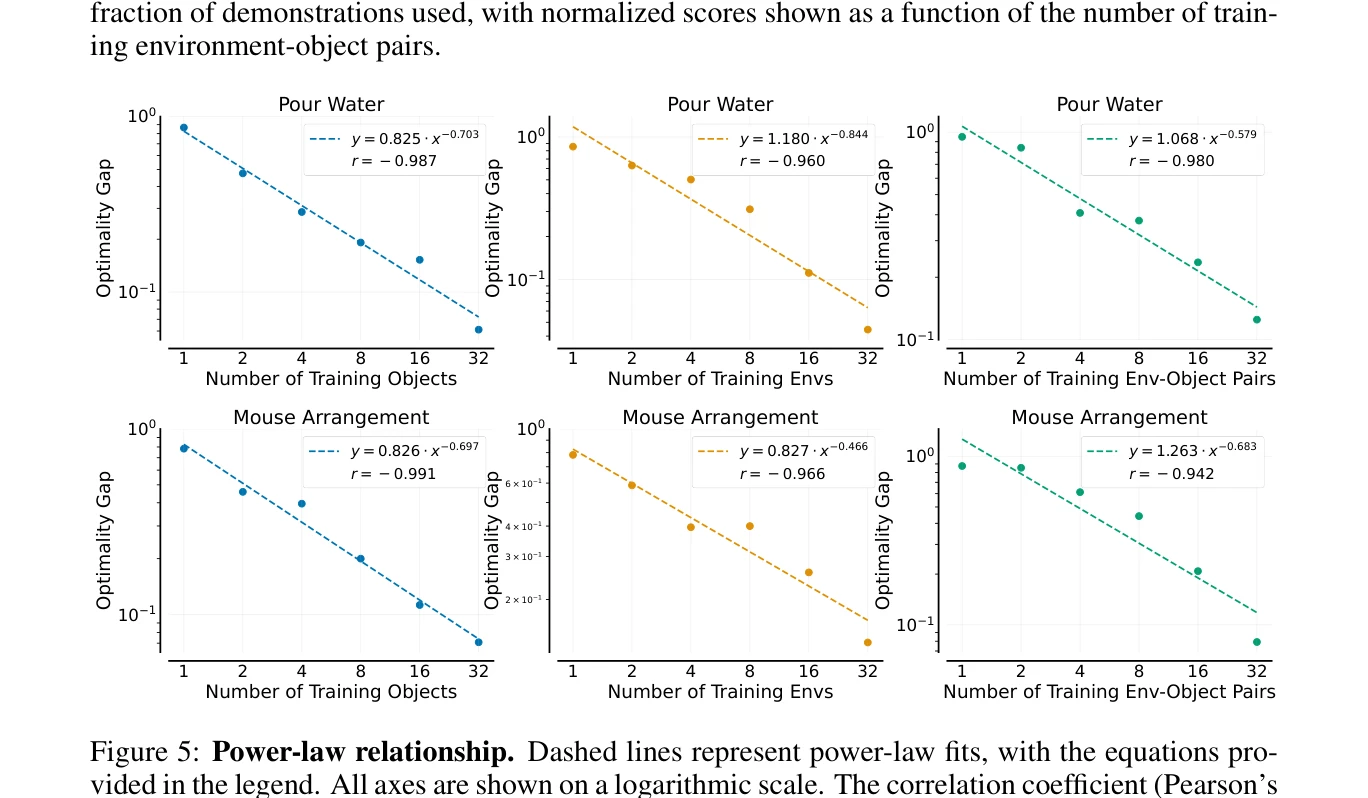
Figure 5: Power-law relationship. Dashed lines represent power-law fits, with the equations pro-
로봇 조작 학습에서 데이터 스케일링 법칙을 실증적으로 규명하고, 환경과 객체 다양성이 절대적 데이터 양보다 중요함을 보여주었으며 이를 기반으로 효율적인 데이터 수집 전략을 제시한다.
저자: Yingdong Hu, Fanqi Lin, Pingyue Sheng, Chuan Wen, Jiacheng You, Yang Gao | 날짜: 2024-10-24 | URL: https://arxiv.org/abs/2410.18647 📄 PDF
Figure 5: Power-law relationship. Dashed lines represent power-law fits, with the equations pro-
로봇 조작 학습에서 데이터 스케일링 법칙을 실증적으로 규명하고, 환경과 객체 다양성이 절대적 데이터 양보다 중요함을 보여주었으며 이를 기반으로 효율적인 데이터 수집 전략을 제시한다.
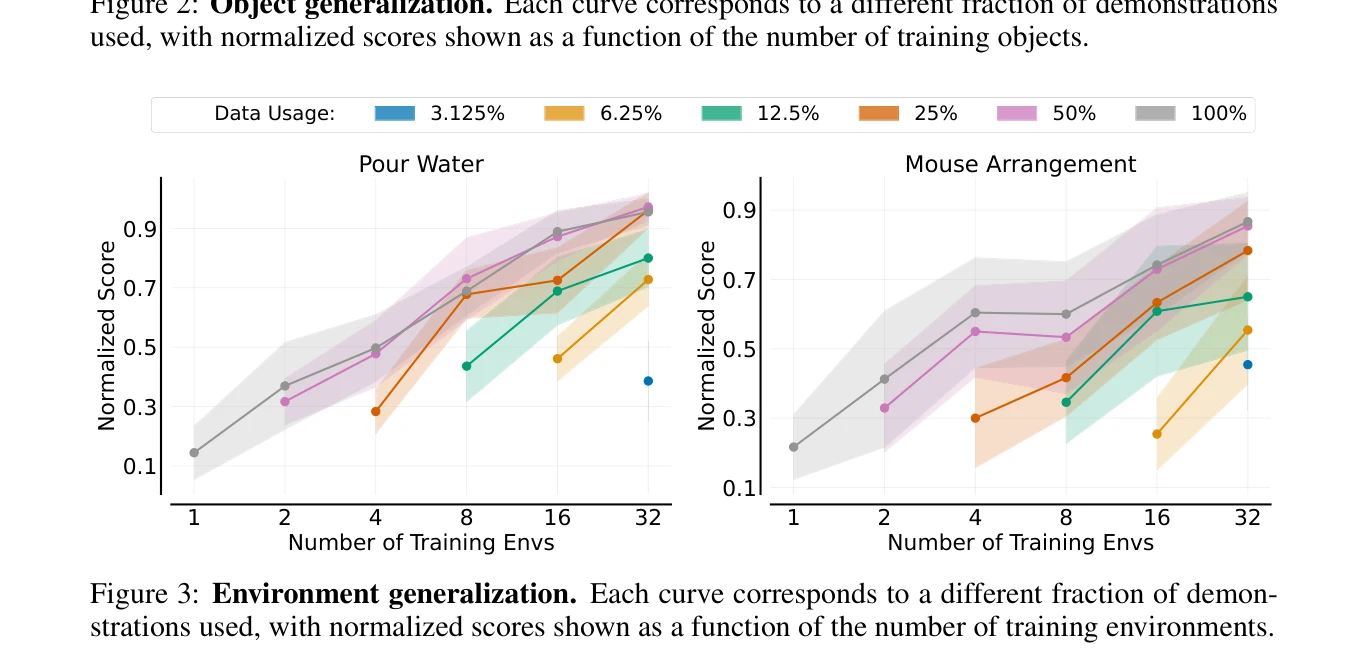
Fig. 3 presents the results, revealing several notable patterns: (1) Increasing the number of training
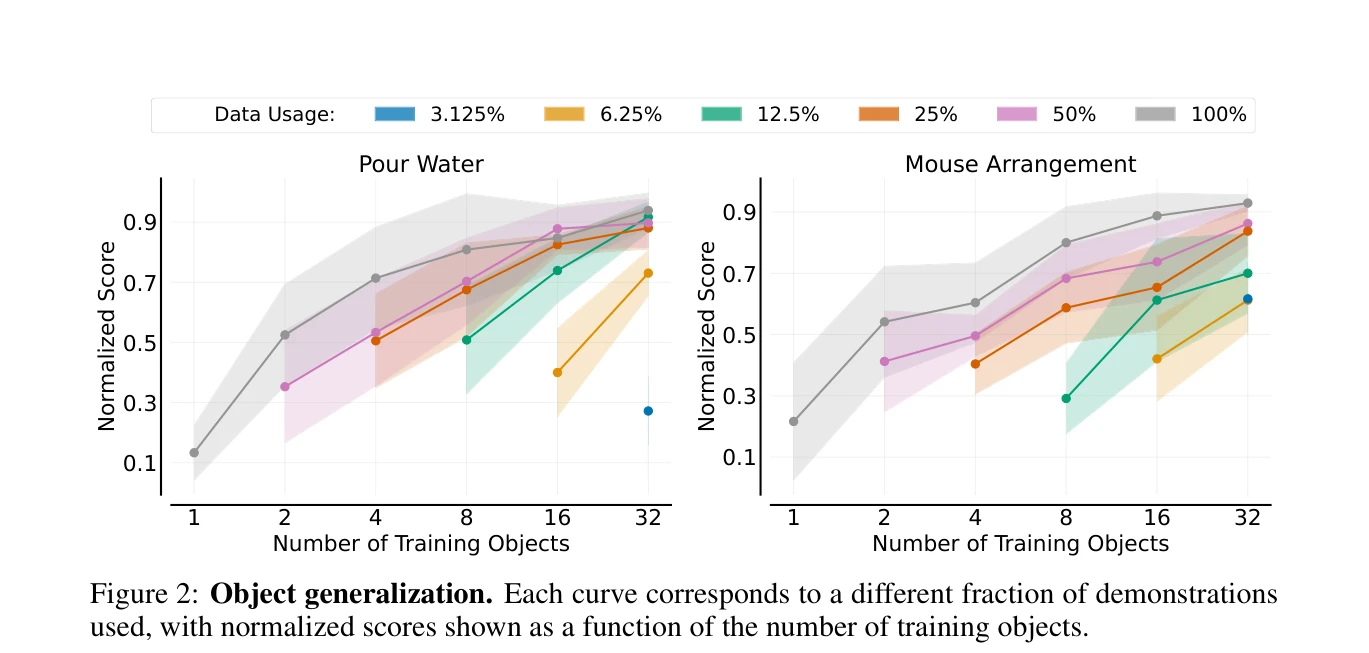
Fig 2 presents the results, with shaded regions representing 95% confidence intervals. There are sev-
총평: 로봇 조작 분야에서 처음으로 체계적인 데이터 스케일링 법칙을 40,000개 이상의 실제 시연과 엄격한 평가 프로토콜을 통해 규명한 중요한 실증 연구로, 환경-객체 다양성의 우월성이라는 실용적 인사이트는 로봇 데이터 수집 전략의 혁신을 가져올 수 있는 고임팩트 논문이다.