Essence
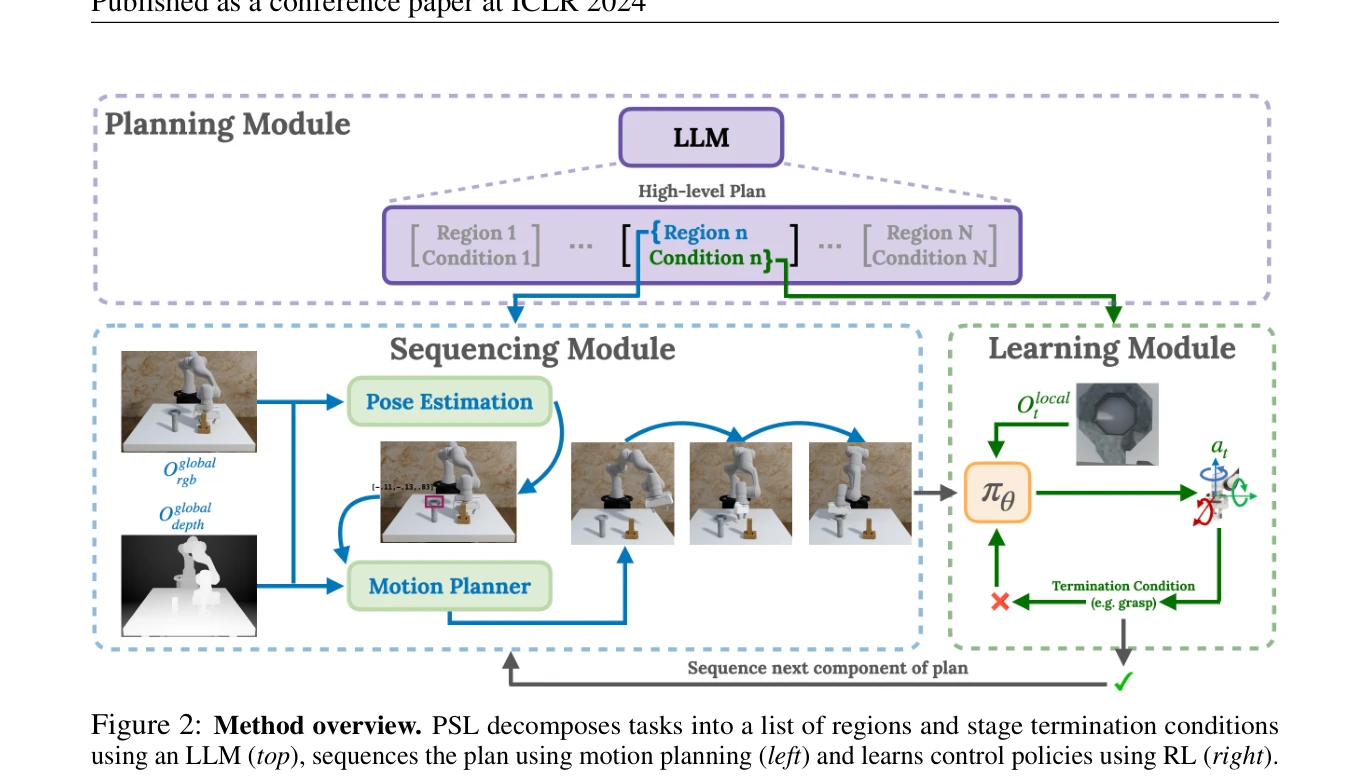
Figure 2: Method overview. PSL decomposes tasks into a list of regions and stage termination conditions
Plan-Seq-Learn (PSL)은 LLM의 고수준 계획, motion planning의 시퀀싱, RL의 저수준 제어 학습을 통합하여 사전 정의된 스킬 라이브러리 없이 장시간 로봇 작업을 해결한다.
저자: Murtaza Dalal, Tarun Chiruvolu, Devendra Chaplot, Ruslan Salakhutdinov | 날짜: 2024-05-02 | URL: https://arxiv.org/abs/2405.01534 📄 PDF
Figure 2: Method overview. PSL decomposes tasks into a list of regions and stage termination conditions
Plan-Seq-Learn (PSL)은 LLM의 고수준 계획, motion planning의 시퀀싱, RL의 저수준 제어 학습을 통합하여 사전 정의된 스킬 라이브러리 없이 장시간 로봇 작업을 해결한다.
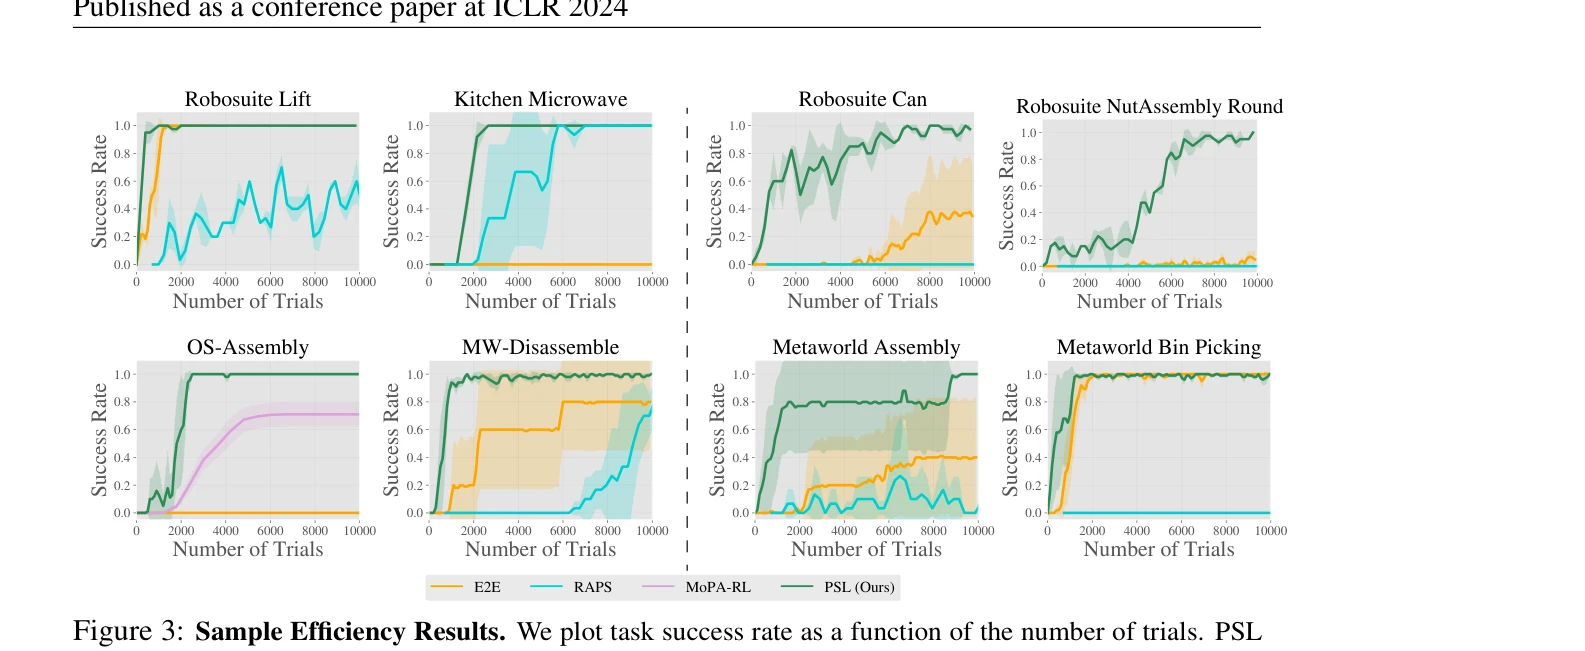
Figure 3: Sample Efficiency Results. We plot task success rate as a function of the number of trials. PSL
Figure 2: Method overview. PSL decomposes tasks into a list of regions and stage termination conditions
총평: PSL은 LLM, motion planning, RL의 상호 보완적 강점을 창의적으로 통합하여 사전 정의된 스킬 없이 장시간 로봇 작업을 효율적으로 해결하는 실질적이고 강력한 방법을 제시한다. 광범위한 실험과 명확한 설명으로 높은 가치의 기여를 입증한다.